
Summary
ChartMogul is a SaaS metrics and growth platform that aims to bring analytics, forecasting, and benchmarking into a single place for subscription businesses. It is used by a range of organizations—from early-stage startups to more established SaaS companies—to clarify key subscription metrics and inform revenue-related decisions. Typical users include customer success teams, data analysts, finance and operations professionals, and company founders.
A core capability is consolidating subscription data from multiple billing systems so teams can view metrics such as MRR and churn across different billing models and currencies. The platform also includes features for analyzing trial behavior and cohorts, which can support product-led growth analyses and help teams understand conversion dynamics.
ChartMogul provides automation and workflow features that let teams trigger actions based on subscription events; these are intended to streamline processes that may improve conversion and retention. Integrations are available via a mix of native connectors and third-party tools (e.g., Zapier/Make) to help move data between systems.
On pricing, ChartMogul offers entry-level access alongside tiered options designed to scale as a company’s subscription business grows; free tiers or trial options are commonly available to let teams evaluate the product. Overall, the tool is suited to organizations focused on improving subscription reporting and operationalizing revenue insights, though companies should evaluate whether its integration and automation capabilities match their specific billing and data needs.

Product Overview & Key Takeaways
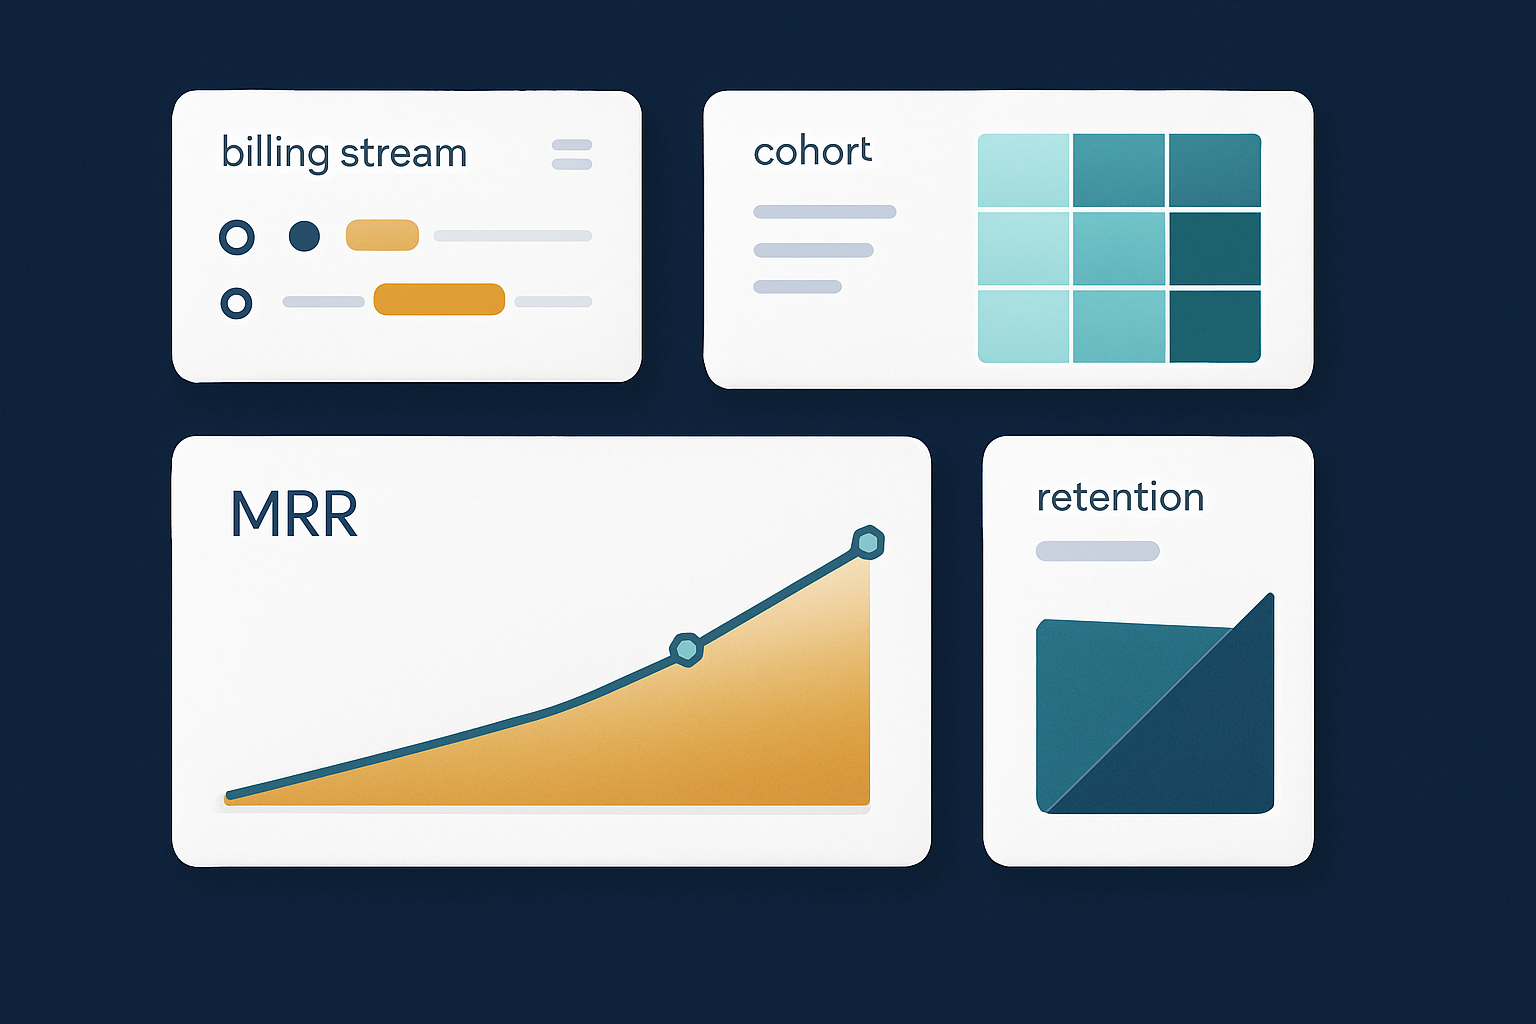
ChartMogul is a metrics and growth platform focused on subscription businesses. It is designed to aggregate subscription data from multiple sources and surface core SaaS metrics—such as MRR, ARR, churn, and customer lifetime value—alongside forecasting and benchmarking capabilities to help teams monitor financial health and growth trends.
The tool targets a range of users involved in subscription growth and operations: customer success, analytics and engineering teams, finance and operations, founders and execs, and marketing. It is commonly used by growing SaaS companies and by teams that need to manage more complex billing scenarios; in practice, it tends to be a fit for businesses moving beyond simple billing setups and those handling higher-volume or multi-system revenue streams.
ChartMogul is built to accommodate multiple billing systems and a variety of subscription models, including tiered plans, add-ons, and usage-based charges. It also includes features for tracking revenue across currencies, which can help teams understand FX effects on their metrics. Integration and export options are part of the platform: it typically connects with common billing platforms and supports data exports to major data warehouses, either via native connectors or through third-party integration tools (e.g., Zapier/Make). The product also provides basic CRM-style features—tasks, notes, and simple email sequencing—to support customer management and internal workflows.
Key Takeaways
- Comprehensive subscription analytics: Aggregates billing data and reports key SaaS metrics, with built-in forecasting and benchmarking to inform growth decisions.
- Broad user applicability: Useful to multiple roles across product, customer success, finance, and executive teams that need visibility into subscription performance.
- Handles complex billing patterns: Designed to work with tiered plans, add-ons, usage billing, and multi-currency setups common in modern SaaS.
- Integration and export flexibility: Supports connecting billing sources and exporting data to data warehouses via native and third-party integrations.
- Basic CRM and workflow support: Includes tasking, notes, and email sequencing to help teams coordinate around customer accounts.
In summary, ChartMogul is positioned as a practical analytics layer for subscription businesses that need consolidated metrics and reporting across multiple billing sources. It is particularly relevant for teams managing more complex subscription models or scaling their revenue operations, though organizations should evaluate whether its integration and CRM capabilities meet their specific needs.
- Ease of use7.4
- Automation depth7.6
- Integrations8.7
- Pricing value8.0
- Support docs7.3
Verdict at a Glance
ChartMogul is best suited to subscription-first businesses and teams that need detailed visibility into recurring revenue and customer behavior. It tends to work well for product, finance, and customer success teams that track metrics such as MRR and ARR and want to use that data to inform growth and retention efforts.
Strengths include support for a range of billing models (for example, tiered plans, add-ons, and usage-based billing), integrations with common billing systems via native connectors and third-party tools (e.g., Zapier/Make), and customer-focused reporting that can help with trial conversion and churn analysis. The platform also includes features to support sales and customer success workflows, and larger organizations can access more advanced capabilities and bespoke pricing arrangements.
There are accessible entry points for smaller teams to evaluate the product through trial or demo options and lower-tier plans, while larger customers can pursue enterprise features and custom contracts.
Tradeoffs to consider: ChartMogul may be more than necessary for companies that do not operate on a subscription model or that have very simple billing needs. Implementing and maintaining integrations and custom reporting can require time and coordination, so teams should weigh the platform’s analytical depth against the effort of setup and ongoing management. Overall, it’s a strong option for teams that need granular subscription analytics and are ready to incorporate those insights into their growth and operations.

Core Use Cases & Who It’s For
ChartMogul is a subscription metrics and revenue analytics platform that is primarily aimed at businesses running recurring-revenue models. The items below summarize where it tends to add the most value and the situations where teams may want to consider alternatives.
Best For
-
Tracking Subscription Metrics
Useful for teams that need ongoing visibility into MRR and other subscription KPIs. ChartMogul is commonly used to assemble revenue timelines and analyze metrics across tiered, componentized, or usage-based billing models. -
Product-Led Growth (PLG) and Trial Analytics
Teams running trials or freemium models can use the platform to track trial conversions and related revenue signals, helping to diagnose where free users do—or do not—convert to paying customers. -
Workflow Automation
The product includes automation features triggered by subscription events. These can help operationalize churn-reduction or conversion workflows by linking revenue events to downstream actions. -
Unifying and Cleaning Revenue Data
Organizations that pull billing and customer records from multiple sources will find tools to standardize and reconcile revenue data, often via no-code/low-code connectors and mapping interfaces. -
Collaborative Revenue Workflows
ChartMogul provides collaboration features (tasks, notifications, mentions and in-app notes) tied to revenue data, which can help cross-functional teams coordinate around account- and revenue-related activities. -
Importing and Exporting Billing and Customer Data
The platform typically connects with common billing systems (for example, Stripe, Chargebee, Recurly, PayPal) and offers export or sync options to data warehouses and storage solutions (for example, BigQuery, Snowflake, Amazon S3), via native and third‑party integrations (e.g., Zapier/Make). -
Sharing and Viewing Metrics
Metrics can be surfaced to teammates through common channels and apps (for example Slack, support tools, or mobile dashboards), making it easier to distribute KPIs across the organization.
Not Ideal If
-
Small Teams with Simple Billing Needs
Teams with very straightforward billing and limited reporting needs may find the platform’s feature set more than they require and could prefer simpler analytics tools. -
Non-Subscription Businesses
Companies that do not operate on a subscription or recurring-revenue model are less likely to benefit from the product’s core capabilities. -
Organizations with Limited Data Infrastructure
Businesses without basic data processes or the willingness to invest in integrations and data hygiene may not be able to take full advantage of the platform’s capabilities. -
Businesses with Minimal Need for Automation or Deep Analytics
If automation and detailed subscription analytics are not priorities, many of the platform’s features may go underused.
Conclusion
ChartMogul is generally a fit for subscription-focused, data-oriented teams that need consolidated revenue reporting, trial and conversion analysis, and automation tied to subscription events. The main tradeoffs to consider are implementation and data-work overhead: organizations should assess their existing billing systems, data infrastructure, and the level of analytics or automation they require before committing.
Features & Capabilities
ChartMogul provides a range of tools aimed at helping subscription businesses analyze revenue and manage growth. Below are its primary feature areas, described to give a practical sense of what the platform supports.
Multiple Billing Systems
ChartMogul is designed to consolidate subscription data from multiple billing systems so teams can view revenue in a single place. By unifying billing sources, the platform helps create consistent timelines for subscription events and recurring revenue reporting, which can simplify MRR calculations for businesses with complex billing stacks.
PLG and Free Trial Support
The product supports workflows for Product-Led Growth strategies, including tracking free subscriptions and trial periods. It can surface trial-to-paid conversion behavior and help quantify the revenue impact of free trials, which can inform onboarding and retention experiments.
Add-ons and Usage Overages
ChartMogul can accommodate tiered plans and usage-based components, allowing businesses to capture add-ons and overage charges in their revenue reporting. This helps teams understand how different plan elements and usage patterns contribute to overall revenue.
Multi-Currency Tracking
The platform includes multi-currency reporting features and mechanisms to reflect foreign exchange effects in subscription metrics. This is useful for organizations operating across regions that need a clearer view of FX impacts on MRR and related KPIs.
Workflow Automation
ChartMogul can trigger actions based on subscription events, enabling teams to connect revenue signals to customer workflows. These automations—used alongside CRMs and messaging tools—can help teams respond more quickly to churn signals, upgrades, or trials, and support operational workflows around revenue events.
Core Revenue Analytics
ChartMogul’s analytics suite focuses on standard subscription metrics such as MRR, ARR, churn, Customer Lifetime Value (LTV), and MRR movements. The platform also supports cohort and attribute segmentation, allowing deeper analysis of customer groups and revenue behavior for strategic planning.
Custom Reports and Dashboards
Users can create, pin, and share custom reports and dashboards tailored to team needs. These capabilities support collaboration by making it easier to surface the most relevant metrics for different stakeholders and preserve focused views of performance over time.
Integrations and Sync
The platform offers a range of integration options for importing billing data and connecting to CRM and communication tools. Data can be pushed or routed via webhooks and common integrations; native and third-party connectors (e.g., Zapier/Make) are also available to extend connectivity with other systems.
Data Warehouse Exports
For organizations that perform advanced analytics outside the product, ChartMogul supports exports to major data warehouses and storage solutions, enabling downstream analysis in tools such as Snowflake, BigQuery, Amazon S3, and similar platforms.
Built-in CRM
ChartMogul includes an integrated CRM to help keep revenue and customer data aligned. Typical CRM features include contact notes, tasks, and basic sequencing; additional seats and expanded CRM functionality are available depending on plan and add-ons.
Sources and Destinations
The platform can ingest billing and customer data from a variety of payment and billing providers, and it supports exporting data to warehouses, webhooks, or email-based destinations. These import/export options are intended to fit different data workflows and reporting needs.
Enrichment and Metrics Connections
ChartMogul supports enrichment of customer records with custom attributes via integrations and connectors (for example, Segment or Zapier). It also provides ways to surface metrics in external dashboards and reporting tools through connectors and export options.
ChartMogul Apps
To make metrics accessible across teams, ChartMogul offers integrations and apps for collaboration tools and mobile platforms. These let users view and share key metrics from Slack, support systems, or mobile devices.
In sum, ChartMogul focuses on consolidating subscription billing data, providing standard subscription analytics, and enabling integrations and exports for deeper analysis. These capabilities aim to support SaaS teams that need unified revenue reporting and operational workflows tied to subscription events.
Pricing & Plans
ChartMogul provides tiered plans intended to serve a range of companies, from early-stage startups to larger organizations. Pricing is generally organized around recurring revenue bands and feature sets, with an entry-level free tier for very small-revenue businesses and paid tiers that add more integrations, analytics power, and support for larger data volumes.
Free Plan
The free tier is designed for very small teams or companies just starting with subscription analytics. It typically includes core capabilities for consolidating billing and trial data, basic segmentation, and simple automation based on subscription events. Free plans usually allow team collaboration with role-based controls and limit the number of billing sources you can connect, which may be a constraint for businesses using multiple billing systems.
Pro Plan
The mid-tier (often labeled “Pro” or similar) is aimed at growing businesses that need more integrations and deeper analytics. This tier generally permits multiple billing sources and unlocks more advanced reporting, segmentation, and workflow automation than the free tier. Paid tiers commonly offer a trial period so teams can evaluate the features before committing. The plan is intended to scale with companies moving from startup to mid-market revenue levels.
Enterprise Plan
The enterprise offering targets large organizations with complex subscription models and high data volumes. Enterprise plans usually include support for many billing sources, custom contract terms and pricing, and additional enterprise-grade features such as advanced security, SLAs, and dedicated support. Annual billing is typically available and often priced to offer savings versus month-to-month billing. Enterprise packages may also bundle or offer add-ons for CRM seats and other paid modules for an extra per-user or per-seat fee.
Additional Considerations
ChartMogul runs promotional programs aimed at early-stage companies (for example, temporary discounts or credits) and generally allows customers to move between tiers as their ARR grows. Flexibility around upgrading, downgrading, or cancelling is usually part of the offering. Prospective customers can start with the free tier or request a demo; demo or trial forms commonly ask about product interest (e.g., analytics, CRM) and company size so vendors can tailor the conversation.
Overall, the pricing structure is designed to scale with revenue and usage, but companies should confirm current plan limits, billing terms, and any promotional details directly with ChartMogul before making purchasing decisions.
Pros & Cons
ChartMogul is a subscription analytics platform with features designed to help businesses track revenue and customer metrics. Below is a balanced look at common strengths and limitations reported by users and visible in the product offering.
Pros
-
Broad integration options: ChartMogul provides integrations and connectors for sharing metrics with other tools and dashboards. Teams can surface data in communication and BI tools, and there are options for native and third‑party integrations (e.g., Zapier/Make) to fit existing workflows.
-
Event-driven automation: The platform includes automation capabilities that can trigger workflows based on subscription events. These features can help operationalize responses to churn signals, plan changes, or other customer behaviors when configured appropriately.
-
Built-in customer management: ChartMogul includes customer-management features that let users track accounts, notes, and engagement activity alongside revenue metrics. These capabilities are integrated into the product rather than being a separate add‑on in many plans.
-
Data export and warehouse syncs: Users can export or sync subscription and metric data to external storage and analytics systems. ChartMogul supports connections to popular data warehouses and storage solutions (e.g., BigQuery, Snowflake, Redshift, S3) through native connectors or integration tools.
-
Consolidated view of data: The platform is designed to bring billing, usage, and marketing data together in unified reports, which can aid in understanding customer lifecycle and revenue drivers.
-
Support for multiple billing sources: ChartMogul can ingest billing data from a variety of sources. It provides import options for common billing and subscription platforms (e.g., Stripe, Chargebee, Recurly, PayPal, Zuora) as well as other custom imports.
-
User access model that can scale: Many of ChartMogul’s plans allow broad team access without per-user seat fees, which can simplify access for larger teams. Exact user‑limit policies vary by plan.
Cons
-
Setup can be involved: Integrating multiple billing systems, mapping historical data, and configuring custom reports can be time-consuming. New users may face a learning curve to ensure data is accurate and reports are tuned to their needs.
-
Customization limits on lower tiers: Some customers report that more advanced customization and enterprise-grade features are restricted to higher tiers. Organizations with complex reporting needs may need to evaluate whether a higher plan is required.
-
Reliance on external data quality: The accuracy of metrics depends on the completeness and correctness of connected billing and usage data. Inconsistent or incomplete inputs from external systems can lead to misleading analytics if not addressed.
-
Feature set may exceed small-team needs: Smaller startups or teams with simpler requirements might find they don’t use the full breadth of features, which can affect perceived value versus cost.
-
Pricing tied to tracked revenue/scale: ChartMogul’s pricing model is commonly influenced by the amount of ARR or revenue tracked in the platform. As tracked revenue grows, organizations may move into higher pricing tiers, so teams with rapidly increasing ARR should plan for potential cost changes.
In summary, ChartMogul offers a comprehensive set of subscription analytics and integration capabilities that suit businesses tracking recurring revenue. Prospective users should weigh the onboarding effort, plan feature differences, and the implications of a revenue‑scaled pricing model against their specific data and reporting needs.
Integrations & Ecosystem
ChartMogul’s integrations and ecosystem are central to how teams consolidate subscription data and surface metrics across their stack. The platform provides connectors and export options intended to help businesses bring billing, customer, and analytics data together for reporting and analysis.
Integrations and Sync
ChartMogul supports connections with a range of commonly used billing systems, including Stripe, Chargebee, and Paddle, which are often used to populate subscription timelines and recurring-revenue metrics. It can also integrate with customer tools such as HubSpot, and additional CRM connections are typically available via native or third-party connectors (e.g., Zapier/Make).
Data can be forwarded or synchronized through webhooks and automation platforms, enabling near-real-time notifications and downstream workflows. Teams commonly use these capabilities to surface events and metrics in collaboration and support tools like Slack or Intercom.
Data Destinations
For teams that run analytics outside the app, ChartMogul provides export and ETL options for sending subscription data and derived metrics to common data warehouses and cloud storage—examples include BigQuery, Snowflake, Redshift, and object stores like Amazon S3, Google Cloud Storage, or Azure Blob. Exports can also be delivered via CSV, email, or webhooks, which helps integrate ChartMogul data into existing reporting pipelines.
Enrichment
ChartMogul supports enrichment of customer records through custom attributes and integrations with customer-data and automation tools. Integrations with platforms such as Segment and Zapier, and with CRMs and support tools, let teams append contextual data to customer profiles for segmentation, analytics, and more targeted workflows.
ChartMogul Apps
There are integrations and lightweight apps that make metrics more accessible across teams—examples include sharing metrics to Slack and embedding information in support tools like Zendesk. Mobile access is available through iOS and Android apps or mobile-friendly interfaces, so stakeholders can view key subscription metrics on the go.
Impact on Tech Stack
When integrated into an existing stack, ChartMogul is intended to reduce manual reconciliation by centralizing billing and subscription data and by providing multiple export paths to analytics systems. Its enrichment and connector options can help preserve contextual customer information for marketing, sales, and customer success use cases. Depending on your architecture and tooling, ChartMogul can be used as a lightweight metrics layer or as one component in a broader data pipeline.
Overall, ChartMogul’s ecosystem emphasizes connectivity with billing platforms, customer systems, and data destinations. Exact integration availability and capabilities vary by provider and plan, so review current connector lists and documentation to confirm support for the systems you rely on.
Onboarding, UX & Support
ChartMogul is positioned as a SaaS metrics and revenue analytics platform; this section looks at how that positioning translates into onboarding, day‑to‑day usability, documentation, and support options.
Initial Setup and Data Migration
The platform’s onboarding workflow is designed to work for businesses with different sizes and subscription complexities. A common onboarding requirement is migrating historical billing and customer records; ChartMogul provides tools to import, map, and clean incoming data and to reconcile common edge cases. For straightforward migrations these self‑service tools can be sufficient, while organizations with larger or more complex data sets may choose to engage vendor or professional services for assistance.
ChartMogul integrates with a range of billing and subscription systems via native and third‑party connectors (for example, Zapier/Make), which helps when pulling data from multiple sources or from an existing analytics provider. The product also includes features to accommodate subscription models and currency considerations, though the exact capabilities and configuration effort can vary by account and use case.
User Interface and Experience
The user interface emphasizes clarity and quick access to key metrics. Dashboards are customizable and support saved views or reports, which teams can use to surface the metrics most relevant to their roles. Visualizations and reporting are arranged to help users scan multiple metrics at once and to drill into details when needed.
There is still a typical learning curve with a full‑featured analytics tool: new users often need time to become familiar with available reports, segmentation options, and account configuration settings. For teams that monitor many metrics or require tailored views, the platform’s customization options can reduce day‑to‑day friction once set up.
Tutorials and Documentation
ChartMogul publishes documentation and learning resources intended to guide users from basic setup through more advanced analytics. These resources commonly include written guides and how‑to articles, and may also include webinars or video walkthroughs to support team training. The documentation generally covers key workflows and troubleshooting topics, enabling many users to resolve routine questions without contacting support.
Support Channels
Support is available through a mix of documentation, in‑app resources, and direct support channels. The exact scope and response times for direct support (for example, email or chat) can depend on the customer’s plan and the vendor’s current policies. In addition, community forums or knowledge base articles can supplement direct support for common questions and configuration examples.
Because timely issue resolution is important for teams that rely on real‑time metrics, prospective users should confirm the level and responsiveness of support included with their chosen plan before committing.
Conclusion
ChartMogul’s onboarding, UX, and support mix aims to balance self‑service configurability with assistance for more complex migrations. Its import and mapping tools, customizable dashboards, and published documentation make it suitable for teams wanting a focused revenue analytics solution. Tradeoffs to consider include the setup effort required for complex historical data and the variability of hands‑on support depending on account level and migration complexity.
Limitations & Gotchas
While ChartMogul is a capable subscription analytics platform, there are practical limitations and tradeoffs that surface in real-world use. These are worth considering when evaluating the tool for your stack.
Billing Source Limits
ChartMogul limits how many billing sources you can connect, and that allowance depends on your plan. Lower-tier plans typically permit only a small number of connected billing systems, which can be a bottleneck for businesses that use multiple payment gateways or billing platforms. Even higher-tier plans increase the allowance but may still require prioritizing which systems to sync first. This can lead to partial data coverage unless you consolidate billing sources or use additional data-aggregation steps.
Scalability Concerns
The platform is designed for subscription businesses, but organizations with rapidly growing or very large ARR may encounter cost and complexity considerations as they scale. ChartMogul’s pricing generally scales with revenue volume, and larger data sets can introduce heavier data-management and reporting needs. Some companies therefore supplement ChartMogul with custom tooling or additional analytics platforms as their requirements become more complex.
Workflow Integration Challenges
ChartMogul includes automation and workflow capabilities, but integrating those into established operational processes can require effort. Businesses with bespoke or non-standard workflows may need custom development, middleware, or manual processes to bridge gaps. Relying solely on out-of-the-box workflows may not be sufficient for highly customized environments.
Data Sync and Real-Time Updates
Data synchronization behavior varies depending on the billing systems and integrations in use. While ChartMogul connects to many billing platforms (via native and third-party integrations, e.g., Zapier/Make), users report that sync frequency and latency can differ by source. Delays or discrepancies between ChartMogul and upstream systems can affect the freshness of metrics, which matters for teams that depend on near-real-time reporting.
Multi-Currency and Global Operations
ChartMogul supports multi-currency scenarios, but accurate reporting across currencies requires attention. Handling conversions, taxes, and the impact of exchange-rate movements can be complex and may need additional configuration or reconciliation workflows—especially for businesses operating in regions with volatile exchange rates or complex tax regimes.
Role-Based Permissions
The platform offers role-based access controls to manage user permissions, and it can scale to accommodate many users. In practice, organizations with large teams or complex hierarchies may find permission setup and ongoing governance to be time-consuming. Ensuring appropriate access without exposing sensitive data typically requires careful planning and periodic review.
Conclusion
ChartMogul provides useful subscription analytics, but it is not without tradeoffs. Common considerations include limits on connected billing sources, scaling costs and complexity, integration work for custom workflows, data sync timing, multi-currency handling, and the overhead of permissions management. Understanding these areas ahead of time can help you plan integration strategies or identify complementary tools to address gaps.
How It Compares to Key Alternatives
ChartMogul is positioned in the subscription metrics and growth platform category. When comparing it to other solutions in this space, common decision criteria include pricing and packaging, usability, governance and security, integrations, learning curve, and the types of teams it serves best.
Pricing Model
ChartMogul uses tiered pricing that is intended to serve businesses at different stages of growth. Entry-level options and higher-capacity tiers are available, and vendors in this category often offer trial periods or low-cost entry points to help teams evaluate the product before committing to higher tiers. Exact plan names, limits, and costs can change, so teams should confirm current pricing and what is included at each level before deciding.
Ease of Use
The product is designed for straightforward metric tracking and reporting, with a focus on making common subscription and churn analyses accessible to non-technical users. That accessibility can reduce ramp time for teams without deep analytics expertise. At the same time, users who need highly customized analyses or complex, event-level modeling may find more technical platforms better suited to those advanced use cases.
Governance and Admin Depth
ChartMogul provides administrative controls such as role-based access and various data protection features. The vendor also documents compliance with common industry privacy and security practices. Organizations with very specific governance requirements or extensive regulatory obligations should verify the platform’s controls and any relevant certifications against their own policies.
Integrations Pattern
The platform supports connections to many billing systems and data sources, and it can export data to warehouses and integrate with CRM and workflow tools via native connectors and third-party integration services (e.g., Zapier/Make). For businesses with highly specialized or proprietary systems, custom integration work may still be required.
Learning Curve
Adoption typically involves a modest learning curve: users can get value from out-of-the-box reports and dashboards fairly quickly, while power users may need additional time to configure advanced custom metrics or data exports. The onboarding experience and available documentation/support resources are important factors for teams evaluating fit.
Best-Fit User/Team Profile
ChartMogul is generally suited to SaaS teams focused on subscription metrics, customer success, finance, and operations who want a centralized view of recurring-revenue KPIs without building a bespoke analytics stack. It tends to appeal to organizations that prioritize ease of use and rapid insights over highly bespoke analytics infrastructure.
Adjacent Tool Categories
Organizations with needs beyond subscription analytics—such as full-featured CRM workflows, detailed financial consolidation and reporting, or advanced machine learning and data science—may look to adjacent categories to complement a subscription analytics platform. In those cases, ChartMogul is often used alongside specialized CRM, financial analytics, or data science tools rather than as a complete replacement.
In summary, ChartMogul offers a balanced set of features for subscription analytics that emphasizes usability and integrations. Teams should weigh the platform’s ease of adoption and connector ecosystem against any advanced customization or regulatory requirements when considering alternatives.
Best Practices & Tips
These guidelines can help you get more reliable subscription insights and smoother workflows from ChartMogul. They focus on keeping your revenue data accurate, making analytics actionable, and aligning teammates around the same metrics.
Track Subscription Metrics
- Monitor key subscription metrics such as MRR, churn, and LTV on a regular cadence. Track these across different billing systems and models to maintain a consistent view of financial health.
- Use cohort analysis to observe customer behavior over time and to inform retention and expansion strategies.
PLG and Trial Analytics
- Analyze free trials and other free-user cohorts to understand conversion dynamics and revenue impact. These insights are useful for Product-Led Growth experiments.
- Create segments based on trial behavior or product usage to target marketing and onboarding efforts more effectively.
Workflow Automation
- Automate routine actions using the platform’s integrations and webhooks. Examples include follow-up messages for users nearing the end of a trial or basic notifications for billing events.
- Configure workflows to surface and act on signals of churn risk, such as declining usage or payment failures, so you can run targeted retention campaigns.
Unify and Clean Revenue Data
- Bring together multiple billing sources through native and third-party integrations (e.g., Zapier/Make) or available connectors to create a consistent revenue dataset.
- Regularly validate and clean imported data—reconciling plans, currencies, and historical billing events helps prevent metric distortions, especially with complex subscription models.
Collaborative Revenue Workflows
- Use the platform’s collaboration features (notes, task assignments, mentions) to keep stakeholders aligned on live revenue data.
- Surface insights to broader teams by integrating with communication and support tools via native or third-party connectors (for example, Slack or Zendesk).
Import Billing and Customer Data
- Import billing and customer data from popular platforms (for example, Stripe, Chargebee, Recurly) via available integrations to centralize reporting.
- Schedule regular imports or syncs so your analytics reflect recent billing activity and customer changes.
Data Migration and Onboarding Support
- Leverage onboarding resources or support channels to help import, map, and validate historic billing data. Proper setup reduces future reporting issues.
- Work with support or implementers to address edge cases—custom billing logic, legacy invoices, or multi-currency setups—that could affect metric accuracy.
Export Metrics and Data
- Explore export options such as sending data to data warehouses (for example, BigQuery or Snowflake), cloud storage, email, or webhooks. Available destinations may vary by plan.
- Automate exports where possible so decision-makers and downstream systems receive up-to-date metrics without manual steps.
General Tips
- Use any available free trial or demo period to evaluate how the platform fits your workflows and data model before committing.
- Periodically review new features and integrations—platform capabilities and ecosystem connectors can change and may improve your analytics or automation options over time.
Following these practices helps ensure your subscription metrics are accurate and actionable, and it makes it easier to scale reporting and retention workflows as your business grows.
Pricing Details & Plan Overview
ChartMogul uses a tiered pricing approach intended to serve companies at different stages, typically including a free/freemium option, one or more paid tiers, and a custom enterprise offering. The lower-tier plan is generally positioned for startups or small teams who want to evaluate core subscription metrics with minimal commitment. Mid-tier plans are aimed at growing businesses that need expanded analytics and support for additional billing sources. Enterprise-level arrangements are typically negotiated for organizations with higher data volume or more complex requirements and often include bespoke pricing and support terms.
| Plan | Ideal for | Pricing model | Notes |
|---|---|---|---|
| Free | Startups, small teams | Freemium | Intended for basic metric tracking and evaluation; subject to limits on data volume and billing sources |
| Pro | Growing businesses | Tiered | Adds more analytics and higher usage thresholds; supports additional billing sources and integrations |
| Enterprise | Large organizations | Custom / tiered | Designed for high-volume or complex use cases; pricing, limits, and support are typically customized |
Pricing, feature availability, and usage limits can change. Check ChartMogul’s official pricing page or contact their sales team for the most current details and to confirm which plan matches your needs.
FAQ
In this section we address common questions prospective users have about ChartMogul’s capabilities, integrations, and support to help you evaluate the platform.
Does ChartMogul support multiple billing systems?
ChartMogul is built to consolidate subscription data from multiple billing systems so companies can view timelines and recurring revenue metrics in one place. This is useful for organizations that run different billing platforms across products or regions. Integration methods vary by source (native connectors, API imports, or third‑party sync tools).
Can ChartMogul handle Product-Led Growth (PLG) models with free trials?
ChartMogul can track free subscriptions and trial periods and provide analytics on conversion and retention. These reports can help teams understand trial-to-paid behavior, though the level of detail available depends on how trial and user data are sent to ChartMogul from your billing or product systems.
Does ChartMogul support multi-currency reporting?
ChartMogul supports multi-currency revenue reporting and includes mechanisms to account for different currencies and exchange-rate effects on metrics. The exact approach to currency conversion and historical FX treatment can vary, so review the product docs for specifics relevant to your needs.
Do I need a credit card to start the free trial?
ChartMogul offers a free trial period for new users. In many cases a credit card is not required to begin the trial, but signup requirements and trial length can change—check the current signup flow or terms for the most up-to-date information.
How is Annual Recurring Revenue (ARR) calculated for pricing?
ChartMogul commonly aligns pricing with the ARR tracked in the account, using active subscription data to determine tiers. Because pricing models can change, confirm how your ARR will be measured with ChartMogul during purchase or in the pricing documentation.
What happens if our ARR grows beyond our plan limit?
If tracked ARR moves beyond your current plan’s limits, vendors typically offer automatic tier upgrades or will contact you to adjust your plan. Expect ChartMogul to provide options to scale the account, but confirm the exact process and any billing implications with their sales or support team.
What integration types does ChartMogul support?
ChartMogul supports a range of integration types, including data sources, destinations (exports), apps/connectors, enrichment, metrics connections, email integrations, and APIs. Many customers combine native connectors with third‑party automation tools (e.g., Zapier/Make) to fill gaps.
Which billing platforms can I import from?
ChartMogul supports imports from many commonly used billing and payment platforms. Examples commonly supported include Stripe, Chargebee, Recurly, Braintree, PayPal, Paddle, Zuora, QuickBooks, and Shopify, among others. Additional systems can often be connected via APIs or third‑party integrators.
Where can I export my subscription data and metrics?
You can export data to popular data warehouses and object stores (for example BigQuery, Snowflake, Redshift, Amazon S3, Azure Blob Storage, and Google Cloud Storage), and also via webhooks, email destinations, and automation tools. Exact export options and formats depend on your plan and the connector you use.
Is there a free trial?
Yes—ChartMogul provides a free trial so teams can evaluate the product before committing to a paid plan. Check the current signup details for trial length and any requirements.
How do existing customers get help?
Existing customers have access to ChartMogul’s support resources, which typically include a support team, documentation, and knowledge-base articles. Some customers also use community forums or account managers for additional assistance.
Which products can I inquire about?
You can contact ChartMogul to discuss its core subscription analytics offering as well as any related services or packages they provide. Sales can clarify which product bundles or add‑ons best match your use case.
This FAQ covers typical questions prospective users raise about ChartMogul’s features, integrations, and support—but specifics can change, so verify details with ChartMogul’s website or sales team for the most current information.

Conclusion
ChartMogul presents itself as a consolidated analytics platform for subscription businesses, with tools aimed at unifying metrics, forecasting, and benchmarking. Its feature set is targeted at teams focused on customer success, finance/analytics, and subscription operations.
A notable aspect of the platform is its ability to connect with multiple billing systems and surface a unified view of subscription metrics. This can be useful for organizations with more complex billing arrangements that need to track timelines and standard subscription KPIs such as MRR and churn. The product also includes capabilities for common subscription scenarios — for example, tracking trial conversions, supporting product-led growth flows, and handling multi-currency reporting — though exact feature coverage and limits vary by account and integration.
ChartMogul is generally most relevant to growing SaaS teams, founders, and operators who rely on subscription metrics to guide decision-making. It exposes customer-level subscription data and offers automation hooks tied to subscription events, along with an ecosystem of integrations that extend workflows across finance, sales, marketing, and operations. The platform also provides ways to move data into larger analytics stacks, including exports to major cloud warehouses (e.g., BigQuery, Snowflake) via native or third-party integrations.
For larger or scaling companies, ChartMogul aims to offer scalability and flexibility, and the vendor typically provides a range of pricing tiers — including entry-level options and paid plans — alongside demo and onboarding pathways. There are also occasional programs or discounts aimed at early-stage companies, which can help reduce costs for qualifying startups.
That said, ChartMogul may be less appropriate for organizations that do not rely on subscription-based models or for teams that need highly specialized features outside the platform’s core focus. In those cases, evaluating tools tailored to specific business models or niche requirements is advised.
In summary, ChartMogul is a capable option for SaaS businesses looking to centralize subscription analytics and operationalize growth metrics. Prospective users should review current feature details, integration support, and pricing tiers to confirm the platform meets their specific technical and reporting needs. For alternatives and broader category guidance, see our VS / Alternatives and Best SaaS Tools articles.